Higher Accuracy Velocity that Feeds Automated Product Roadmapping
A more accurate way to capture sprint velocity of a scaling team, and a framework to leverage that real-time velocity to automatically project a time-based roadmap.
Published on March 11, 2024 by Ken Henderson
Development Velocity Atlassian Jira Software Development Operations Google Sheets Automation
13 min READ
I spent the majority of my early career working in & leading professional services companies, but in recent years I’ve had the opportunity to lead a product software development team…..which is a very different game operationally. One of the biggest challenges that we had (which turns out to be a common challenge) is how to track and communicate the roadmap. It seems simple on the surface, but when you factor in 2-4 different squads working on the same product, doubling the size of the team over the course of a year, and a constant shift in priorities due to a various external factors, it gets complicated very quickly.
Below outlines the framework I built to address the challenge. We’ve been successfully using this for over 3 years, and have made a few iterations along the way. Before diving further into the framework, let’s align on key terminology. If you’re familiar with Software Development terminology, you can probably safely skip the next section.
Terminology
- Squad: A group of software developers that work together to build/maintain a software product. Our squads contain no more than 10 people, and contain team members from various communities - Front-End, Data, SRE, Cloud, Quality, etc.
- Squad Lead: This is the person responsible for running the squad. More specifically, they maintain the backlog log of activities, help the team overcome technical hurdles, and are overall accountable for the day-to-day activities. Our internal title for this role is “Product Architect”, and we’ve built the traditional “Scrum Master” responsibilities into this role.
- Sprint: The term Sprint is commonly used in the Scrum Software Development Framework. A sprint is a fixed period of time that a software development squad works on a specific task or set of tasks. Our squads work in 2 week sprints, where we plan what we want to accomplish, execute the plan, demo and retrospect the results, and feed that into the next 2 weeks.
- Features, Epics, Tasks, & Points: A Feature is something new that we want to bring to the product. Epics align to features, often 1-to-1, but for larger features we may have multiple epics. Each Epic has a number of tasks that need to be done to complete it. These tasks range from front-end, back-end, testing, documentation, etc. Before the sprint begins, the development team gets together to “Groom” the Epic, which includes breaking it down into these smaller tasks and agreeing on the size (number of “Points”) of each task.
- T-Shirt Size: Each Epic is given a T-shirt size (S/M/L) when it’s first added to the engineering backlog. The Squad Lead & Product Manager work together to estimate the appropriate T-Shirt size. It’s important to note that this takes place much earlier than the detailed grooming, but by having a T-Shirt size applied, we can apply a more accurate estimate of how much time it’s going to consume in the roadmap.
- Software Development Velocity: A measure of how fast a squad is delivering value to the product. This is typically based on the volume of “Points” related to tasks, but we’ll explore this further in sections below.
- Task Classification: We classify every task as either “Feature” or “Maintenance”. This helps us put another lens on where our efforts are going. Equally important, this feeds into an automated way to classify portions of salary costs as a Capital Expenditure. More on this topic in a future blog post!
The Challenge
Most tools track software development “velocity” simply by the number of “points” completed within a sprint. And leaders love to use velocity as a KPI - answering the questions of how fast are we delivering features, and are we continuing to increase or decrease in velocity. But when you’re doubling the size of the team, your naturally completing more points over the course of the sprint. So it’s going to appear as though your velocity is increasing, and can artificially mask inefficiencies unless you “normalize” velocity by people. When I first started digging into this in 2021, there were no tools on the market that integrated with Jira (our development tooling). So I decided to build a framework (based on Google Sheets) with the following goals;
- An Automated connection to Jira: I didn’t want to manually refresh the tickets in each of the squads - that should just happen in the background.
- A Current Sprint Resource Planning Component: Making it easy to roll-up the number of “member-days” (more on this later).
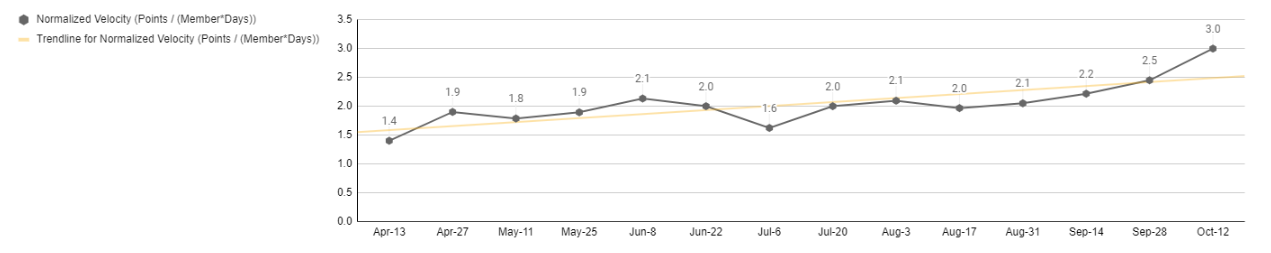
- A Sprint History Component: Logging key metadata about the sprints and providing insights into real-time “normalized velocity”.
- A Running Log of Completed Epics: Enabling quick analysis of the actual points per T-Shirt.
- A 12-month Resource Projection: Based on hiring plans, when do we anticipate team members onboarding (or offboarding) from the squad
- A fully-automated Roadmap: Using the squad’s Epics (in order of priority within Jira) we can incorporate all of the information above into an automated view of what’s been completed and what’s in front of the team, and based on squad size, normalized velocity, & T-shirt sizes, we can begin to accurately predict when Epics will be complete. This is the holy-grail of roadmaping!
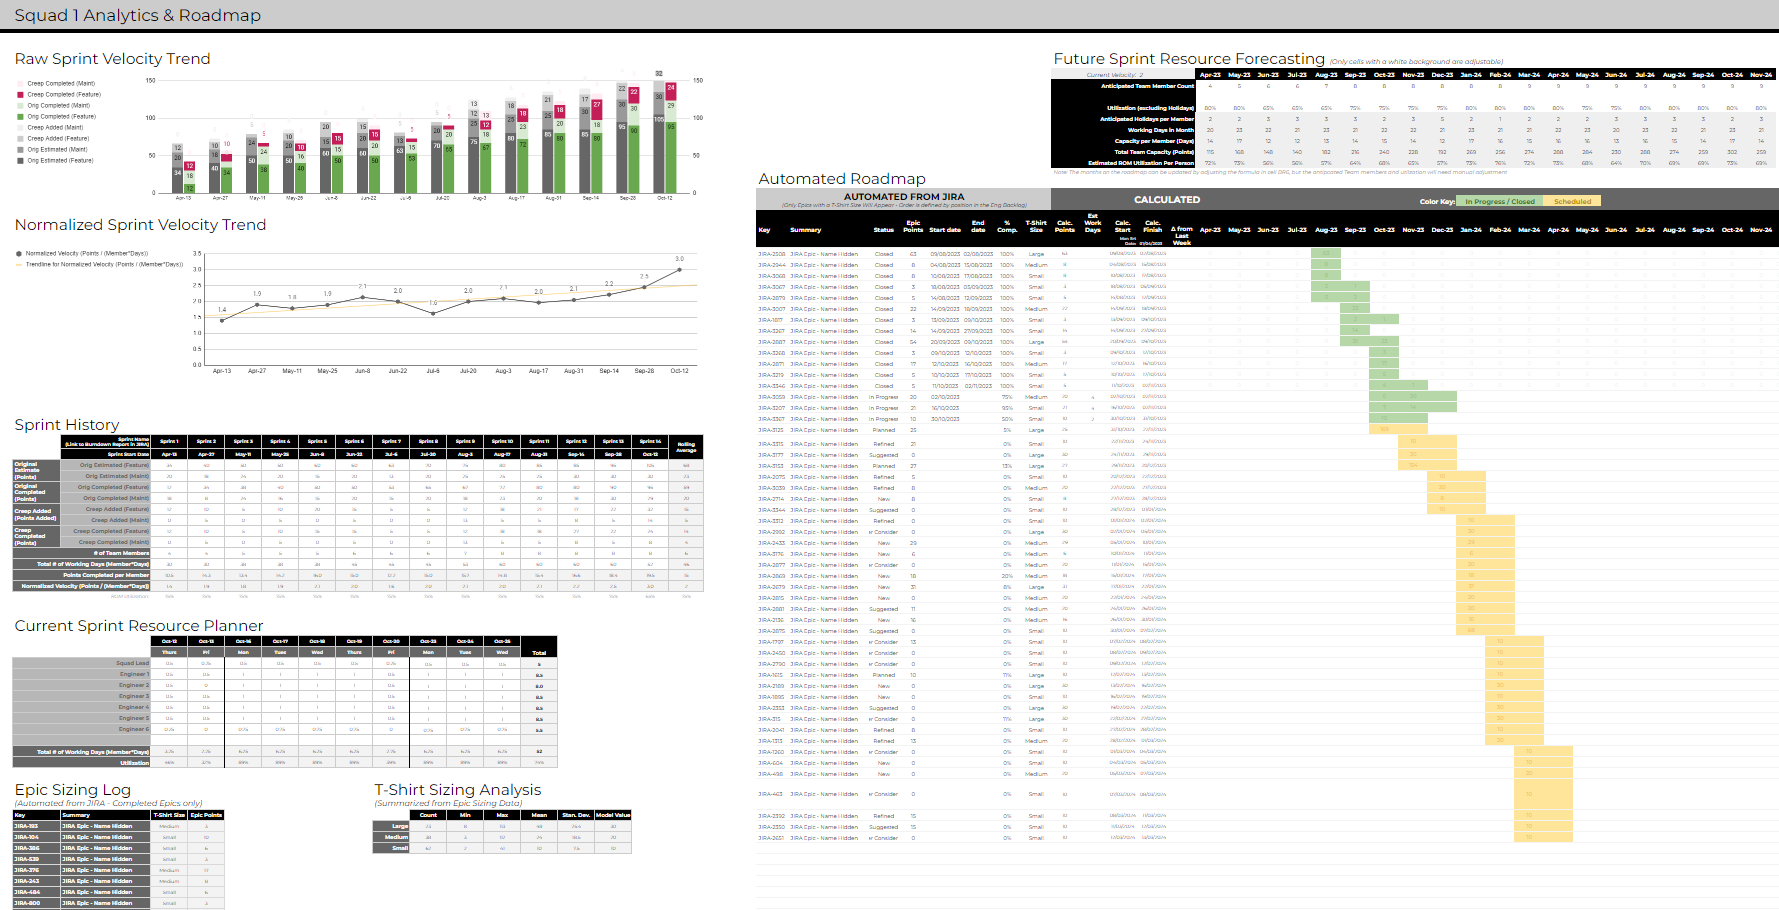
The end result looks like the following. In the sections below, we’ll break each component down.
Current Sprint Resource Planner
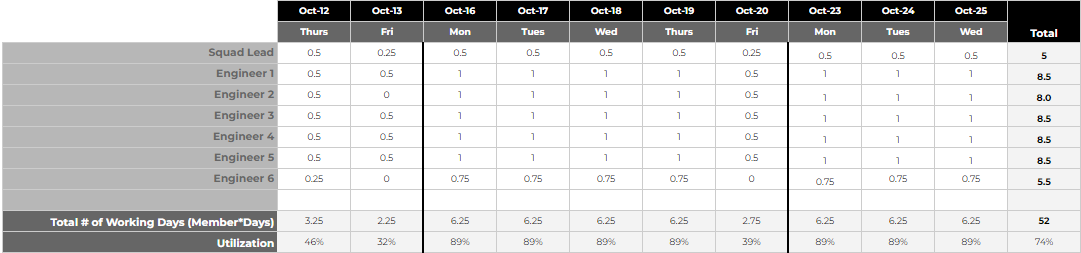
This section was actually added in the second iteration of the framework. The Squad Leads thought it would be helpful to have a quick view that could be populated when they kick-off the Sprint. It became very useful to review this with the entire team - capturing time-off where appropriate and factoring in personal-development time. Capturing this information served 2 key purposes 1.) It gave Squad Leads deeper insight into the time available, which lead to more accurate sprint planning. Note: our Squad Leads are not the line managers. See my blog post on how we’re structured. 2.) It automatically calculates the “Member Days” which are needed at the conclusion of the Sprint. Below is an example view of how the Resource Planner component is used.
Sprint History
This section captures key metadata about the sprint, and is typically completed by the Squad Lead at the completion of the Sprint. We track the following elements;
- Originally/Initially Estimated Points: The sum of Points associated with all tickets that we originally estimated to be complete within the Sprint.
- Originally/Initially Completed Points: The sum of Points associated with all tickets that were actually completed within the sprint.
- Creep Added Points: The sum of Points associated with tickets added/spiked into the Sprint. The addition of tickets/points to a Sprint after the start of the Sprint is often referred to as Creep.
- Creep Completed Points: The sum of Points associated with tickets added/spiked into the Sprint that were completed during the Sprint. Some will roll into the following Sprint.
- The Feature/Maintenance Split within the above 4 Categories: While grooming every ticket we classify it as Feature or Maintenance. We do this based on a specific set of criteria, which is defined by our CapEx/OpEx reporting framework (more on that in a future Blog post). Besides CapEx/OpEx reporting, it’s very helpful to keep a tight pulse on how much of the efforts are going into Feature vs Maintenance. Obviously an increasing amount of Maintenance points is a bad sign.
- # of Team Members: This comes from the Resource Planner view above, and is simply the count of people working in the squad for a specific Sprint. It doesn’t matter whether the person was full time or not, that’ll get factored in on the next bullet.
- Total Number of Working Days: This is calculated from the Resource Planner, and is a sum of all days worked by all engineers within the Squad, and factors in time-off, personal development time, etc.
After filling in the above, there’s 2 key outputs that will automatically be calculated by the tool and fed into the Automated Roadmap;
- What we refer to a as Normalized Velocity. This is simply the total number of Points Completed (Originally Estimated + Creep) divided by the Total Number of Working Days.
- The ROM Utilization of the team, which is simply the “Total Number of Working Days” divided by the “# of Team Members” times 10 (days in the Sprint) Below is an example view of how this section looks.
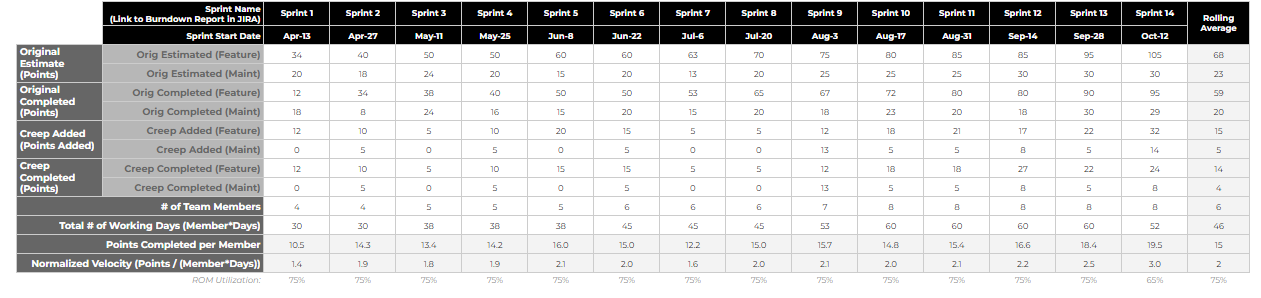
Once you start collecting the Sprint History data, it’s fairly easy to throw a couple of charts on the page. Below are the 2 that we’ve found to be the most helpful. As the team “gels” together, you’ll be looking closely at velocity. The expectation is that they’ll be able to complete more Points per Sprint with the same amount of Members/”Number of Working Days”. In the illustrations above and below, you can see that starting to occur from Aug 17th forward.

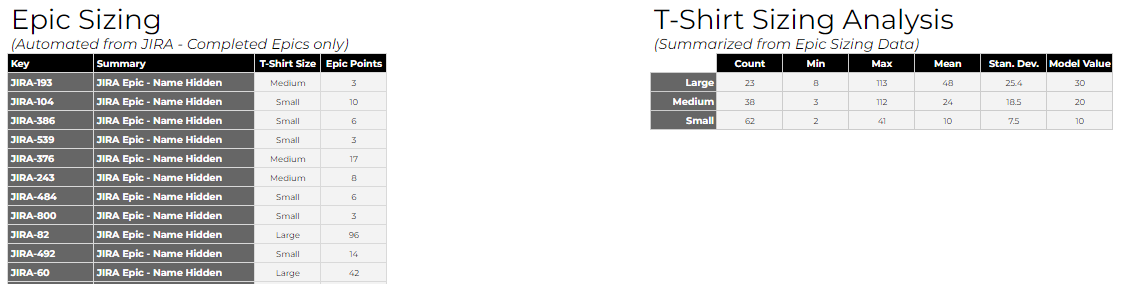
Completed Epics Analytics
This section exposes all of the Epics completed by the Squad, the originally estimated T-Shirt size, and the total number of Points completed as part of each Epic. The ultimate goal of this section is to arrive at what the average number of Points is for a specific T-Shirt size. These are fed directly into the Automated Roadmap, aligning an estimate of Points to early-stage Epics in the roadmap. A few key elements to highlight here;
- When you first start, you won’t have any Epics to average. So in the Analysis portion of this section, we added a column called “Model Values”. This column is manually maintained and is what the Automated Roadmap consumes from.
- Overtime you’ll have a more statistically rich dataset to lean on. So when I review the roadmap with the Squad Leads, we review these numbers to make sure there’s alignment between the Model Values and the averages.
- For Multi-Squad Teams: We’ve found that each Squad points tasks slightly differently. So a “Large” T-Shirt in one Squad might be worth 100 points, where in another Squad it might be 150 points. This framework enables that level of flexibility per Squad.
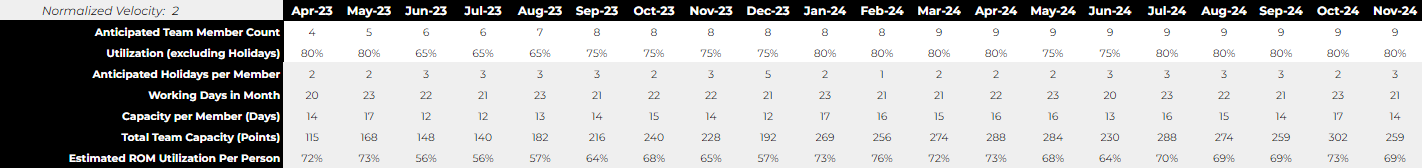
12-Month Resource Projections
This section is where we begin to look forward and project what we think the team size will be. That said, I also encourage the Squad Leads to keep the past 2-4 months on the roadmap - illustrating any potential gaps between what the framework estimated vs what the team actually accomplished. The headcount is mashed together with the number of working days in the month, regional holidays (which are calculated from an external source), and the Normalized Velocity (which is ideally linked directly to the Sprint History section). The output of this is a calculation of the number of Points that the Squad should be able to complete over the course of the month.
A quick note on Utilization - We give the Squad Leads the ability to adjust a Utilization number when entering headcount, accounting for various elements like onboarding, personal development, etc. This is factored into the total number of achievable Points for that month, and at the bottom of the table we expose an overall Utilization (which includes holidays) that correlates to the ROM Utilization that is calculated in the Sprint History section.
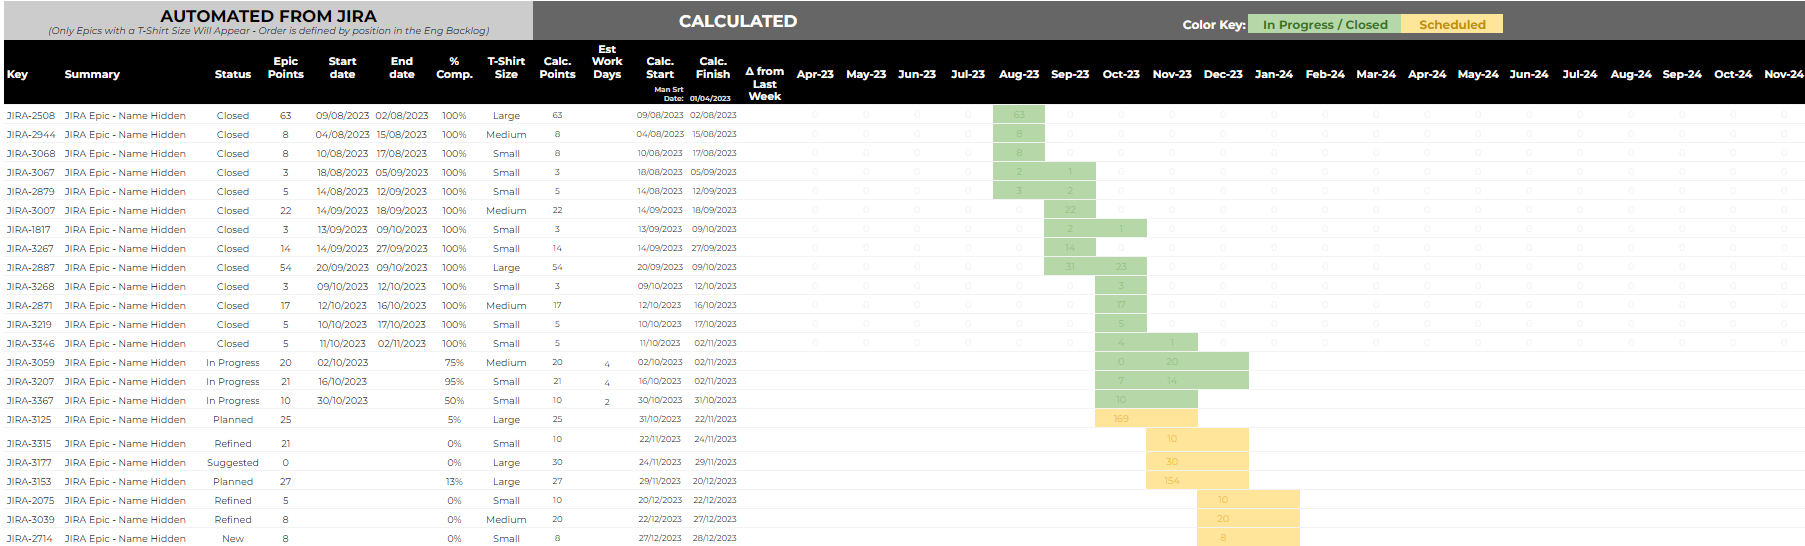
Fully Automated Roadmap
Ok, now we begin to pull it all together! This section is broken into 2 areas;
- A List of Live Epics: This is automated from Jira, using the “Jira Cloud for Sheets” connector. There’s a small helper table in another tab which handles the import on an automated basis, as well as the roll-up of Points per Epic (something we haven’t been able to get through the connector). A key element here - the order/priority of Epics (top down) comes directly from how the Epics are ordered in Jira. So if a Squad Lead wants to shift an Epic up in Priority, they need to do it in Jira and then refresh the framework view.
A Calculation of Points Per Month per Epic: There’s a good amount of logic that went into getting this correct. Each cell looks at the Epics Status, T-Shirt Size, Epics prior to it, and the total available Points per Month (from the 12 Month Projection section) to determine how many points to populate that specific cell with. A couple quick examples;
- If the Epic is “Closed”, then we take the Start Date & End Date from Jira and spread the actual points over the days the work was done, splitting by month.
- If the Epic is “In Progress”, then we take the start date from Jira, estimate number of points (from the T-Shirt Size), look at the available/remaining points in that Month, and calculate the Points that can be consumed in this cell. The logic gets tricky here, as we account for multiple “In Progress” Epics running in parallel, which ultimately decreases the number of Points in this specific cell and spreads the End Date out further.
- If the Epic is in any other/future stage, then we simply stack it’s start date after the previous Epic, estimate number of points (from the T-Shirt Size), look at the available/remaining Points in that Month, and calculate the number of points that can be added to the cell.
A Calculation of Start Date and End Date: This is a fair bit easier to calculate, but there are still a couple nuances to consider.
- Start Date: If the Epic Status is “Closed” or “In Progress”, this comes directly from Jira. Otherwise, we calculate it based on the finish date of the Epic above it.
- End Date: This is calculated based on what month (and where in the month) the last Point of the Epic was completed.
Below is the end result of what you’ll get from everything above.
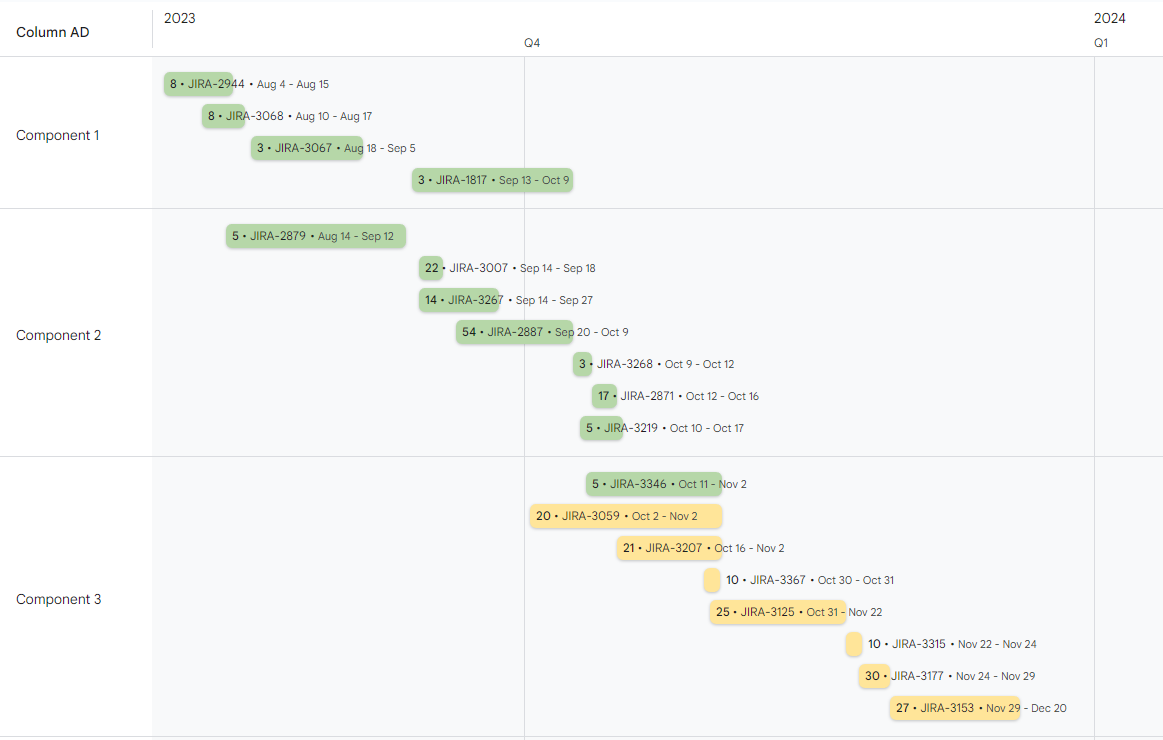
Above has a good amount of details, and we find it very helpful when collaborating within the engineering team and with Product Managers. If you’re looking for something a bit less spreadsheet-like to communicate with the rest of the world, then no worries….Google has you covered. You can very easily use their Timeline View chart to create something similar to below. I added a lens of “Components” here, which we’ve used both Jira Versions and Components for. Just like everything else, those can be automated into the view.
If you’d like access to the framework, templates, or just want to chat, please feel free to reach out!